Saturday, March 26, 2011

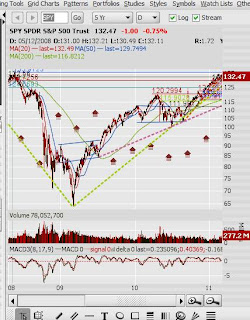
Spy Big Trend Support Never Broke

Well my last blog I told you to watch the green trend line and how it was major support. the next day we broke through it but! Yes never confirmed the break the very next day closed above and for over a week the market has moved up. I think we are close to a top and a move back down. Why do I think that, is the pink trend line was support early Mar. broke to run to the green trend line. So support now become resistance. Where are we ,back at the pink trend line now resistance.

Disclaimer: Steelman's Technical Charts are my own amateur interpretations of technical charts and for informational purposes only and should not be construed as investment advice regarding the purchase or sale of securities, or any other financial instrument of any kind. Please consult with your financial adviser before making an investment decision regarding any securities mentioned herein. Steelman's Technical Charts assume no responsibility for your trading and investment results.

Sunday, March 20, 2011

Spy At A Big Trend Support

With the green ascending Trend line being major support and if we brake it with a second day confirmation then next support is 121.26. With war at hand and the Japan earthquakes still having effects on this market, this will be a very tricky market to maneuver in so use your stop losses and be very cautious.


Disclaimer: Steelman's Technical Charts are my own amateur interpretations of technical charts and for informational purposes only and should not be construed as investment advice regarding the purchase or sale of securities, or any other financial instrument of any kind. Please consult with your financial adviser before making an investment decision regarding any securities mentioned herein. Steelman's Technical Charts assume no responsibility for your trading and investment results.

Sunday, March 13, 2011

FDX Keep a Eye On it Bearish Signal

Keep a eye on FDX  it has a bear flag forming with the flag coming into 2 averages that are very close together creating a heavy resistance area. Maybe this is one peace of the puzzle to tell us where the S&P next move is.
The other part of this puzzle is FDX has just pulled back from a double top so maybe this bear flag is telling us its getting ready for the second leg down. FDX is one stock I don't trade but like to watch to give me a idea of what the economy is doing. Because they move many goods for many corporations its a good indicated for the general market.

Please read the disclaimer at the top of the blog.

Saturday, March 12, 2011

NBIX Full of Technical Moves

I have not traded this stock and using it as to show the technicals behind the charts.

Please read the disclaimer at the top of the blog.

Friday, March 11, 2011

SPY 129 Big Support Still in Tack


Well yesterday I posted and said I wouldn't be adding any new short because 129.72 was major support. Well we penetrated it today but closed above so it is still in tack. I think I will stay Neutral  on the SPY here because this was the 1st hit of the 50 average in quite awhile. I think I will wait to see if we get a double top 135 area or we get a break through the 129.72 with a second day to confirm it before I make any trade on it.

Please read the disclaimer at the top of the blog.

DRYS Map of a good Call but Not the Trade

Well sold my DRYS Mar puts at a break even trade. Had a great call on the H & S but didn't trade it so well. The problem was I couldn't short the stock so went with options and the time didn't work for me. So here we go on the Road map and follow the blue arrows.
#1 bot my Mar $5 put for 38 cents
#2 the option went to 53 cents and the stock came up to a ascending trend line made the 1st hit of the 200 average and I was gonna sell half but didn't and that was my 1st mistake.
#3 Broke the green trend line, penetrated the 200 average again but closed above.  Had opportunity to sell at 45 cents and almost pulled the trigger but didn't.
#4 Well today with options X next week and the stock came into a Gap plus I just ran out of time with my option and sold at .38 cents with a actual commission lost but very minimal
 Now if I could of shorted the share out right like I wanted to I still be 40 cents ahead with out time hurting me. So what next with the DRYS, well I move on to my next trade  and will watch to see if any new patterns come up but not trading this stock until that occurs.

Please read my disclaimer at the top of the blog.

Thursday, March 10, 2011

USO Never got the confirmation

Here we go again the USO broke to new high but we never got confirmation. Monday close was below the Fridays high then Tues. tried to run above Fri. high again only to close the day below again. I neutral here because oil has come a long way and needs to rest before going higher.

Please read the disclaimer at the top of the blog before making any trades.

SPY 129 Big Support

Tomorrow big day on the SPY 129.72 big support with the 50 average getting a 1st hit in a long time. Be cautious here until we break that support and confirm it, I will not be adding to my shorts here until I get my technical signal.

Please check my disclaimer at the top of the blog

GLD Consolidation or is the Party Over

Well  right now it looks like consolidation until the technical tell me different . I said last blog on GLD I thought it would come in and Test the 20 average but that came sooner then later coming about 6 cents from touching it. I am gonna stay neutral with the political tensions see if we break the 20 average before i get bearish on this asset. A hit on the 50 average would still be classified as consolidation. Only a break below the Feb lows would get me bearish.

Tuesday, March 8, 2011

GLD H & S Neck line become point of resistence


If you go back to Nov where I called out a head and shoulders top you see the neck line drawn in red dotted line. It now has become a point of resistance as GLD has moved up. We tried to break new highs on the 1st of Mar. Next day needed to confirm touched the neckline and fell back below the new high trend line.Three days later or yesterday tried to break new highs touched the red dotted trend line and again fell back below the 139.67 resistance line. I think maybe we consolidate here to build some strength to break that new high so watch we don't fall back test the 20 average before moving forwards. I do not trade GLD because gold is very high risk do to political happenings around the world.

 Please read the disclaimer at the top of the blog page and consult a professional stock consultant before making any trades.

Saturday, March 5, 2011

USO Double Top?

 Well here go again number1 rule confirmation and wow it is such a good rule and I wish I can say I invented it but didn't and its one rule I live by trading. My last video on the USO I said I thought it was moving lower and here we go the again my big phrase was IF WE CONFIRM THE BREAK. Well we didn't and if you look at the yellow circle we broke the 2 trend lines and the 200 average on the 15th of Feb. The next day close was above the close of the 15th and closed just above the 200 average not confirming it. Well that became a pivotal area and look where we are today. Possible break 42 which is a major resistance area.
 So Fri we broke the 42 now what? Here I go again and preach need confirmation. We have to see what Mon. will bring us. Do we close above the close of Fri. break and confirm the next leg up higher or not confirm and pull back. I am Neutral here and gonna let the market tell me where it wants to go.

Please read the disclaimer at the top of my blog.

GLD Trying to Break to New Highs

 Well my last call for the GLD was it had a good chance of going to 139 after the bull flag won out. Well we hit that and tried to break out to new highs. But don't get fooled we never confirm the break out. The top red trend line was the last high, on the 1st of Mar. we broke that line (New High) but next day didn't confirm. Number one rule let it confirm before taking the trade. To confirm you have to close higher then the day that you broke the trend or in this case new high. Fri we tried to break the red trend line a second time but pulled back again by the end of day. So I am neutral until we can get confirmation or get some pattern to see where the GLD is going.

Again please read the disclaimer at the top of my blog.

Spy Defying Gravity the movie

Here is the video version for you people that can access videos

SPY defiys gravity

 Well the laws of gravity should bring this market a tumbling but wow is it defying gravity. Well 129.72 is major major support now. If you see the blue arrows on the left you see where twice it bumped it before breaking on the 3 attempt. Now in technicals what was resistance now becomes support once broken and the reverse is true too. So we broke it on the 1st of Feb. ran up then came back to test it on 24th of Feb. then bounced higher. I have 136 as the next major resistance and 129.72 major support. I think until the Fed gives up this propping of the market the 136 is our next target but if we break the 129.72 support and get confirmation I will not load up on too many shorts here.
This chart is to show you where I got the 129.72 (top red trend line )which goes back to Jan of 2008 where there was some consolidation happening before the markets broke down bad. So this is a strong trend line and may take a few attempts at it to break it down to get this market turned down.