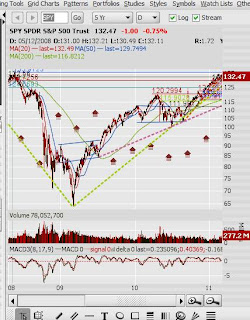
Well the laws of gravity should bring this market a tumbling but wow is it defying gravity. Well 129.72 is major major support now. If you see the blue arrows on the left you see where twice it bumped it before breaking on the 3 attempt. Now in technicals what was resistance now becomes support once broken and the reverse is true too. So we broke it on the 1st of Feb. ran up then came back to test it on 24th of Feb. then bounced higher. I have 136 as the next major resistance and 129.72 major support. I think until the Fed gives up this propping of the market the 136 is our next target but if we break the 129.72 support and get confirmation I will not load up on too many shorts here.
This chart is to show you where I got the 129.72 (top red trend line )which goes back to Jan of 2008 where there was some consolidation happening before the markets broke down bad. So this is a strong trend line and may take a few attempts at it to break it down to get this market turned down.
This chart is to show you where I got the 129.72 (top red trend line )which goes back to Jan of 2008 where there was some consolidation happening before the markets broke down bad. So this is a strong trend line and may take a few attempts at it to break it down to get this market turned down.


No comments:
Post a Comment